How do I navigate the Line Chart view?
The Line Chart view shows the metrics on a line layered in a time-series view.
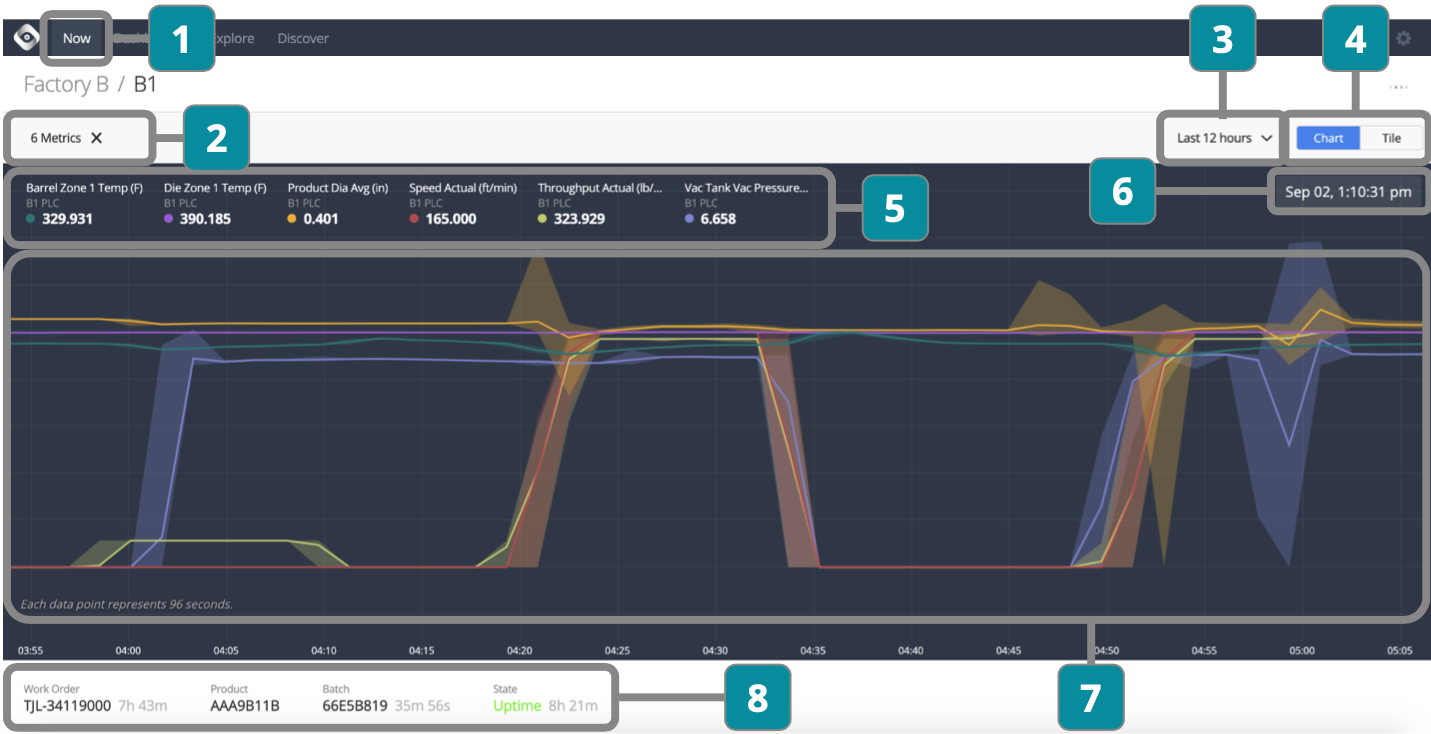
- Choose Line
- Choose metrics to display (once selected they will automatically show whenever line is chosen)
- Choose time period
- Toggle between Chart and Tile views
- View metric values based on where your mouse is located over Section 7
- View date and time based on where your mouse is located over Section 7
- Drag your mouse over time period to zoom in
- View current work order, product, batch, and state information