How do I navigate the Line Tile view?
The Line Tile view shows the time-series behavior of selected metrics side-by-side, with color-coded indication of set-point deviations.
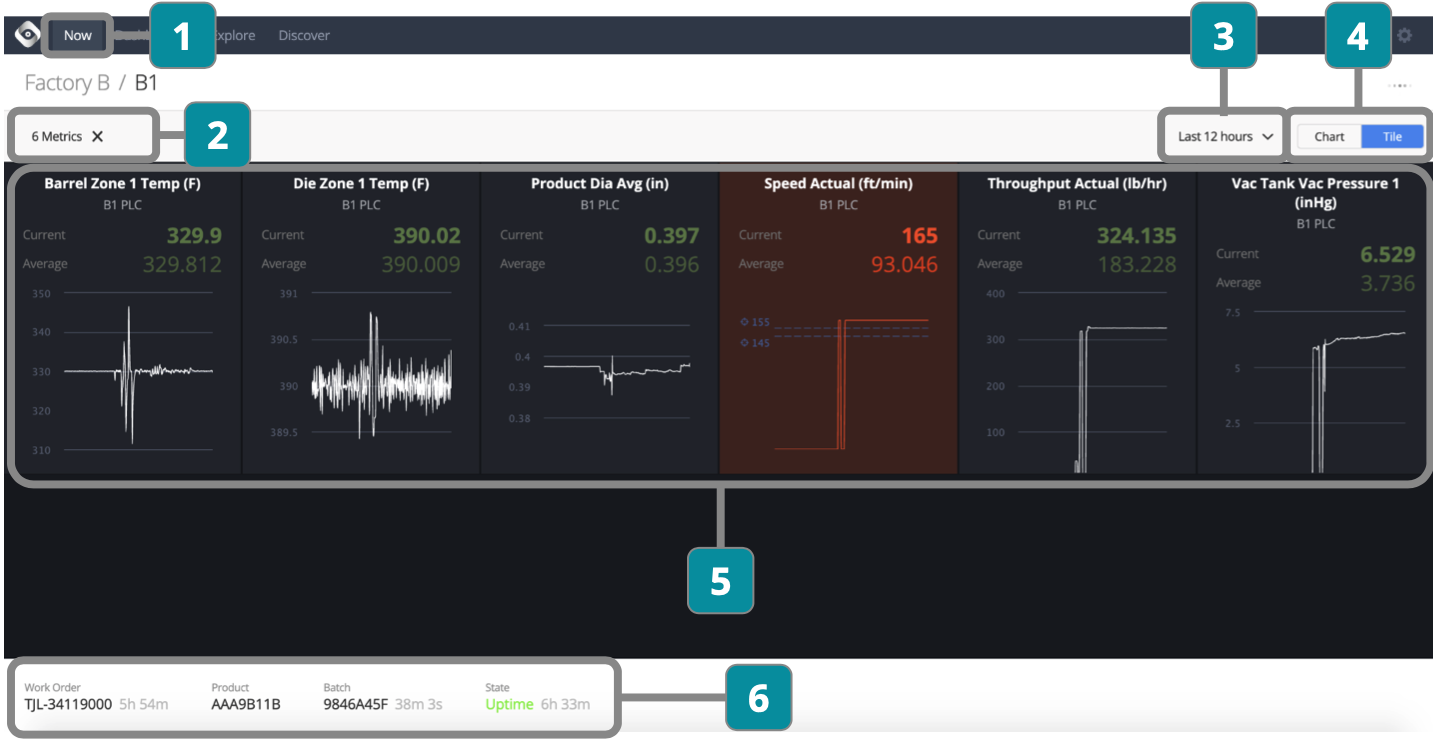
- Choose Line
- Choose metrics to display (once selected they will automatically show whenever line is chosen)
- Choose time period
- Toggle between Chart and Tile views
- View detailed performance for each metric
Color coding indicates if a metric is running outside the limits
Click into each metric to open time series data in Explore
- View current work order, product, batch, and state information